Home » Learn » Articles on Acoustics » Room Acoustics
“Room Acoustics” is the field of acoustics that describes how sound propagates in a closed or semi-closed space. Each space has its own sound ‘fingerprint’ which affects the quality of a sound, whether this is speech, music or any kind of noise. Room acoustic engineers try to understand the behaviour of sound in spaces and make them suitable for different purposes. A classroom should be well designed for clean speech transmission from the lecturer to the students, while a concert hall should prolong and enrich the sound from an orchestra to make it sound impressive.
Key elements in Room Acoustics are the sources and receivers of sound, the geometry of the closed space (room) and the materials (acoustic properties) of the walls.
Sources
Sound is generated by sources, mοdified by its propagation in space and then picked up by the receivers.
Point Sources
The simplest type of source is the point source, where sound is assumed to be generated at an ideal point in space. A point source that radiates sound equally to all directions is called omnidirectional. If radiation is not equal (e.g. stronger in front of the source) a directivity pattern is needed to describe it. Point sources and their directivities can be used to represent the majority of sources in real life, but only when the listener is away from the source at least at a distance comparable to the source:
- A person speaking, where sound comes mostly from the mouth, can be considered a point source if we stand a few centimetres away.
- A loudspeaker can be considered a point source too if we are listening from at least 1m away.
- Musical instruments are a little more complicated because they can radiate sound from different parts (the holes, body, strings etc.), but again they are treated as point sources for most practical room acoustic applications.
PA line arrays are typically too large and too close to the listeners, so it is not feasible to approximate it as a point source unless very far away.
Line Sources
If we extend the idea of a ‘non-dimensional’ point source to the first dimension, we will get a line source. This is simply a line in space that radiates sound constantly throughout its length. This type of source could be used to describe:
- Traffic noise from a big highway, averaged over time and over many vehicles passing by.
- Pipes that carry noisy flowing liquid.
- PA line arrays
Surface Sources
Extending a line source to two dimensions, we get a surface source. In this case sound is radiated from a whole surface, and this type of source can be used to describe:
- Machines with vibrating surfaces, which are not small enough to be simplified into point sources.
- Noise from crowd in a restaurant or a party.
Array Sources
The last type of source used in room acoustics is the Array Source. This is composed of two or more point sources next to each other, which form a multipole. The overall directivity pattern of the array source is different than the directivities of each of the point sources, due to phase interferences between them.
Receivers
All humans, animals and live organisms with a hearing system are considered receivers. On top of that, electroacoustic equipment such as microphones are also receivers of sound, helping us pick up even very low levels (inaudible for us) and translating sound waves into electric signals and numerical sequences for further processing.
Similar to sources, the simplest type of receiver is a point and omnidirectional one, meaning that sound is picked equally from all directions. Typically, room acoustic parameters are measured with omnidirectional microphones. In this case any information is stored on 1 channel.
However, when we want to represent how humans listen inside a space, we need to describe the receiver as binaural, meaning that both the left and right ear, and shape of head, should all be taken into account. Listening binaurally is far from picking up sound equally from all directions, and therefore the audio information is stored in 2 channels.
Geometry
The most elementary room shape in practice has at least 6 surfaces (unless you’re interested in studying the inside of a pyramid…). All surfaces contribute with reflections to the overall sound from the source to the receiver creating a compound effect, which differs significantly from room to room.
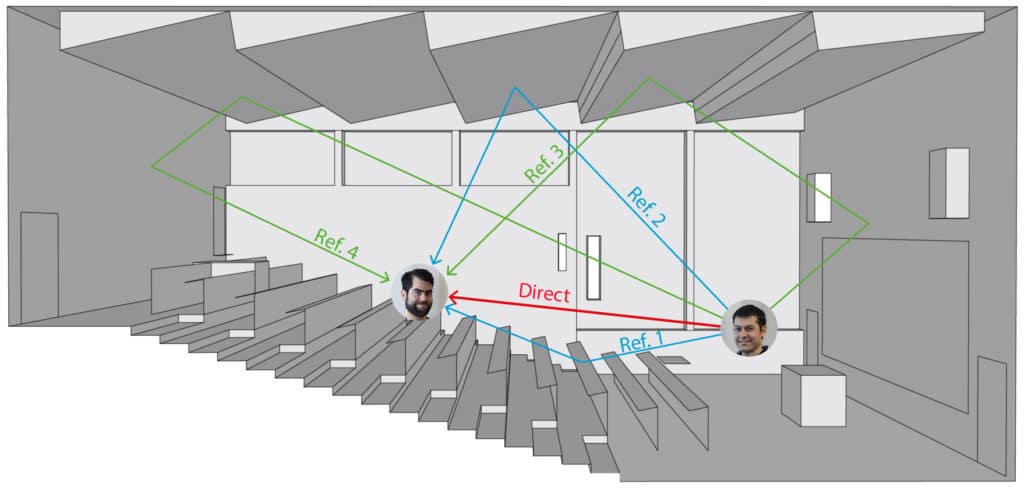
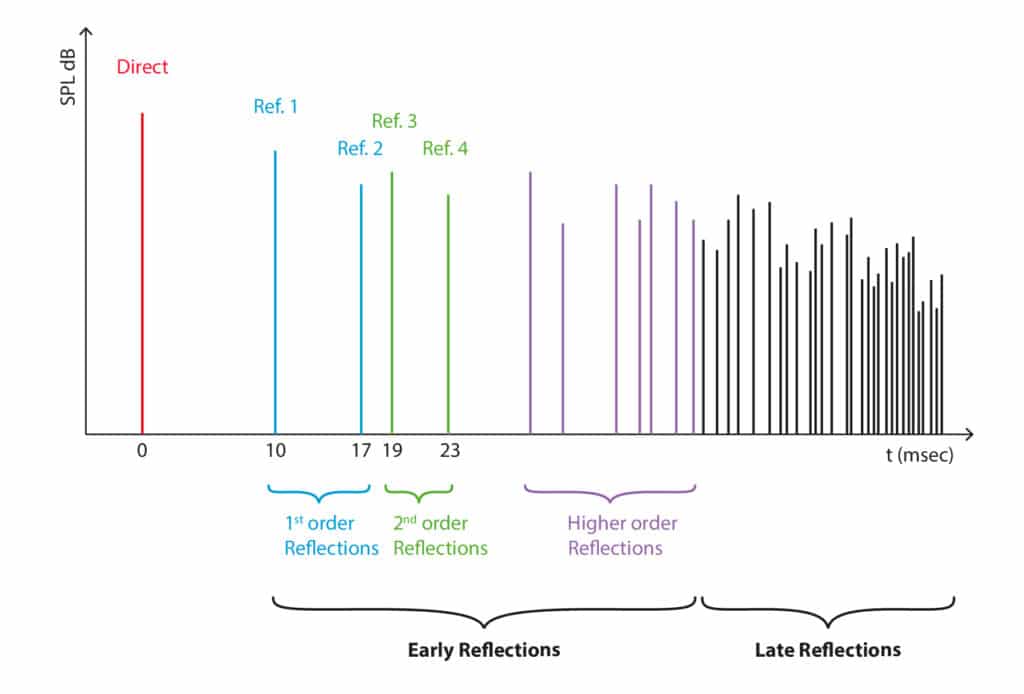
A small part of the sound radiated from any source arrives at the receiver directly (red line in the figure below). There is only one line connecting the source with the receiver directly, therefore there is only one direct sound. If we assume that we have an omnidirectional source, sound is radiated equally to all other directions which eventually hit the walls of the room and get reflected. Many of the reflections will eventually arrive at the receiver at various times after the direct sound, composing a reflectogram. In the figure below, the blue lines represent a 1st order reflection, because sound has hit one wall before arriving to the receiver. On the other hand the green lines represent a 2nd order reflection, because sound has hit two walls before arriving to the receiver.
Early and Late Reflections
The first reflections arriving at the receiver, after the direct sound, are the most important, because they carry information about the actual location of walls around the receiver. Reflections that arrive much later have hit so many walls in between so that they cannot provide information about actual location but mostly about the volume of the room. For this reason, the reflectogram is typically split into Early and Late reflections, as shown in the figure below. Usually, the 1st and 2nd order reflections are considered Early and the rest are considered Late, but the splitting point is actually arbitrary.
At every reflection, part of the sound is absorbed from the wall and loses energy. This repeating loss of energy makes reflections weaker over time, until the initial sound from the source is fully absorbed at the walls. An ideal wall that does not absorb any energy, would be called a rigid wall, while an ideal wall that absorbs all of the energy would be called a soft wall. In real life these extremes do not exist, so no reflections can be maintained forever, nor completely absorbed at the first wall.
Materials
As mentioned before, walls have the ability to absorb part of the sound energy that hits them. This ability comes from the actual material that the wall is built from, and is quantified by the absorption coefficient, a real number from 0 to 1. The absorption coefficient is simply the non-reflected sound energy (absorbed or transmitted) divided by the sound energy that hits the wall.
For an ideally hard wall, no energy would be absorbed, so the absorption coefficient would be 0, while for an ideally soft wall, all energy would be absorbed, so the absorption coefficient would be 1. An open window is the obvious example of an ideally soft surface.
Each material in room acoustics is associated with an absorption coefficient that varies throughout the frequency range. In Room Acoustics, we are mainly interested in frequencies from 125 Hz to 4000 Hz, divided in 6 full octave bands, centred at 125, 250, 500, 1000, 2000 and 4000 Hz. Therefore, a material is described by a series of 6 absorption coefficients. Programs like ODEON work with an additional two octave bands (63 Hz and 8000 Hz), resulting in a total of 8 absorption coefficients.
Additional from the amount of energy lost due to absorption inside a wall, it is interesting to know how the remaining energy is reflected back into the space. If the surface of the wall was ideally smooth, the angle of reflection would be exactly the same as the angle of incidence – as it happens with light that bounces off a mirror. On the other end, if the surface was ideally rough, the reflected sound energy would be scattered (distributed) to random directions (figure below). Again, in reality, no wall is ideally smooth or ideally rough. Therefore, an extra coefficient called scattering coefficient is needed to describe the behaviour of the reflections from real-life walls.

Similar to the absorption coefficient, the scattering coefficient is a number from 0 to 1, and it is defined as the fraction of the reflected sound energy that is scattered to random directions (different from the angle of specular reflection). In simple words, if all reflected sound had an angle of reflection equal to the angle of incidence on a smooth wall, the scattering coefficient would be 0. On the other hand, if all energy was reflected randomly, the scattering coefficient would be 1.
The Impulse Response
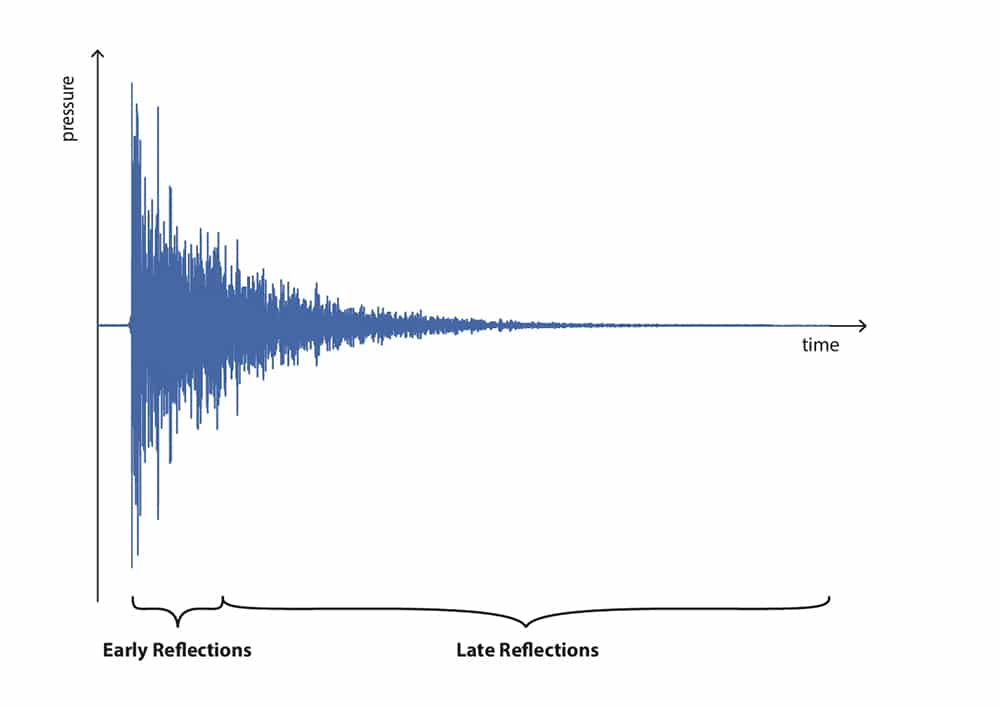
So far, we have seen the reflectogram, as a representation of the reflections arriving at the receiver. However, this is a simplified version of what actually happens in reality. A reflectogram shows only specular reflections and assumes there is no phase difference between them. In reality, the combination of early and late reflections with their progressive absorption and scattering from all surfaces provides a complex graph, which includes phase information and it is called impulse response.
The impulse response is unique for the particular source and receiver locations in the room at the moment of measurement, but does not depend on the actual sound levels. It is the most important source of information for all room acoustic attributes we have mentioned before.
The impulse response is a common concept in various oscillatory systems: electric systems, mechanical systems, and so on. It describes the properties of the system regardless of the input parameters. Therefore, in a classroom with fixed geometry and materials, the teacher’s voice will always be reflected from the walls in the same way regardless of the actual teacher, as long as different students listening take turns standing in one same position. To get the most representative acoustic picture of a room, we need to obtain impulse responses at as many source-receiver position combinations as possible.
We can see that the impulse response has some similarities with a reflectogram in a way that we can split it in early and late parts too. However, since it is derived by measuring sound pressure variations with a microphone it has an exponential decay, occupying both positive and negative sides of the vertical axis (phase information).
If we take the square of that graph and then the 10th logarithm we will get the energy impulse response, expressed in dB. The exponential decay now becomes almost a straight line and the graph looks more similar to the reflectogram. The reason is that a reflectogram is computed in the energy domain, with phase information already simplified.

Room Acoustic Parameters
The Room Acoustic Parameters are calculated from the energy impulse response, as we have seen it just above, and they quantify various sound attributes in the room. If somebody asks you: ‘How does this room sound?’, perhaps you could give answers like: it’s dry, dead, rich, loud, long-lasting sound, hard to listen to others speaking, blurry, etc. All these subjective judgements can be turned into objective parameters which are called Room Acoustic Parameters. A full list can be found in the ODEON User Manual, but below are listed some of the most important ones:
Reverberation Time is the most frequently used parameter in room acoustics. It is approximately the time it takes for a sound to decay and cease to an inaudible level after a loud sound source has been switched off.
The most common experience of reverberation time in a space is when making a single hand-clap. This corresponds to a loud sound source which has been ‘turned on’ and ‘off’ almost momentarily, leaving a decaying tail of sound that takes a few seconds to cease (or less, depending on the room). Reverberation time can reveal information about the size and absorption of a room. Large rooms with sound reflective surfaces have longer reverberation times, while small rooms with sound absorptive surfaces have short reverberation times. The reverberation time of a room is defined as the time it takes for the sound to be attenuated by 60 dB after the source has been switched off. This is noted as T60. However, when measuring reverberation time in practice, there is always a considerable level of audible background noise in the recording (ambient noise, electric noise in electronics, etc.) which reduces the usable dynamic range to less than 60 dB. Therefore, in a measurement, the reverberation time is calculated based on smaller decay ranges instead (10 dB, 20 dB or 30 dB), and then the obtained time is multiplied by an appropriate factor to extrapolate the time for 60dB decay.
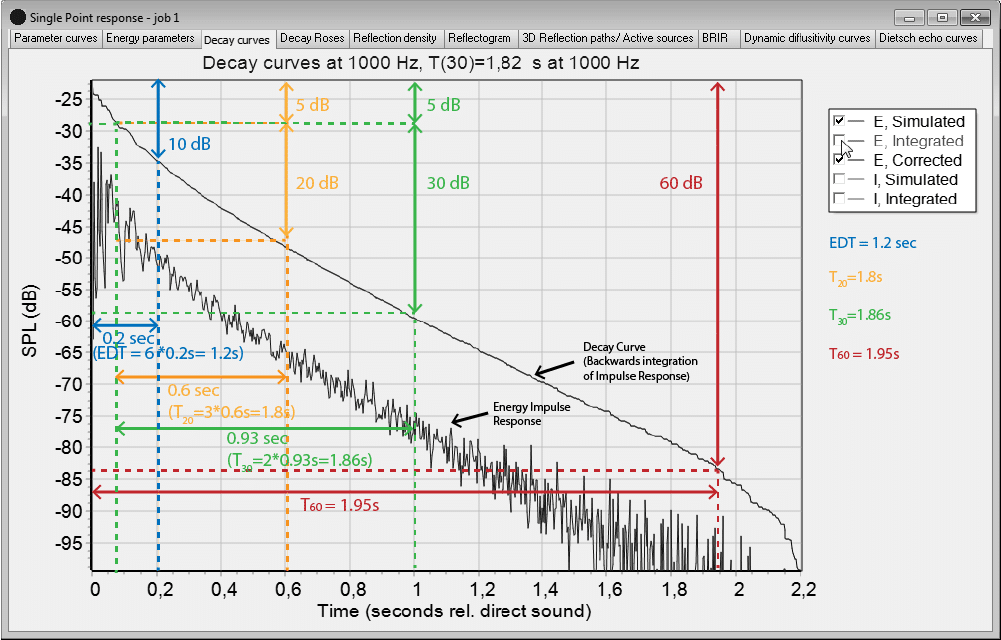
Modern measurement methods do not use the interruption of a noise source, which causes stochastic variations of the results. Instead, the impulse response is measured with an impulse source or a sine-sweep followed by appropriate signal processing. When the impulse response is squared it becomes an energy impulse response. The backwards integrated squared impulse response is the perfect decay curve for the actual position in the room, because it is the curve that would be the result of averaging an infinite number of interrupted noise curves. Calculating reverberation time from the decay curve results in three different types of reverberation times. The following graph shows the process:
Below are three commonly used types of reverberation time:
- Early Decay Time (EDT) is obtained from the initial 10 dB drop of the backward-integrated decay curve, by applying the best-fit linear regression line between 0 and -10 dB. Assuming that decay is linear, extrapolation of the 10 dB range to 60 dB, requires multiplication by 6. In the example above, the time elapsed for 10 dB decay is 0.2 s. Therefore EDT=6*0.2=1.2 s.
Early Decay Time has to do with the first sound reflections only. If a sound source is continuous, e.g. speech or music, a lot of the reverberation of a sound event will be masked by the next sound event, resulting in the late part of the reverberation becoming unnoticeable. Early decay time can be a better parameter than Reverberation Time to investigate the experienced reverberation of continuous sound sources.
Since the early part of the decay is dominated by the direct sound and it is much steeper than the rest, EDT is usually shorter than the other types of reverberation times.
- Reverberation time T20 is obtained by applying the best-fit linear regression line between -5 dB and -25 dB and then multiply the time interval by 3. In the example above T20=3*0.6=1.80s.
- Reverberation time T30 is similar to T20. The regression line is found from -5 dB to -35 dB and then the time interval is multiplied by 2. In the example above T30=2*0.93=1.86s.
Clarity describes how clearly speech or music can be heard by the listener. Late reflections tend to deteriorate clarity. Therefore, the longer the reverberation time, the lower the clarity.
Speech Transmission Index, similar to clarity, is used to described how clear speech is transmitted in the room and perceived by the listener. The calculation of the Speech Transmission Index is more complicated than Clarity, taking into account the amplitude modulation of speech, and the background noise. The parameter ranges from 0 (bad) to 1 (Excellent) and it is unitless. The parameter is calculated according to IEC 60268-16 standard.
What is the difference between Room Acoustics and Building Acoustics?
While Room Acoustics describes the various sound phenomena within an enclosed space, Building Acoustics describes how sound is transmitted from one room to the other in the same building. Building Acoustics is very much related to sound insulation between walls and vibration isolation of different parts of the building structure. Sound that is transmitted in the air through separating walls is called airborne sound, while sound that is transmitted though vibrations of the structure is called structure-borne sound.
ODEON is primarily a Room Acoustics Software, but offers basic tools for predicting airborne sound transmission through walls.
How can you use ODEON for Room Acoustics?
In ODEON you can work with room acoustics in an almost endless number of ways, depending on your purpose. The most common would be:
- Make simulations of acoustics from 3D models, and display them in numerous ways
- Measure the acoustics in real rooms, and get a range of results immediately
- Listen to the acoustics of 3D computer models with the auralization options.
You can read more here.
Calculation principles
In traditional ray tracing, which uses only the image source method (not the sole method used in ODEON), and assuming an omnidirectional point source, the fundamental procedure in a simulation is to have a point source emit a sound ‘ray’ to a random direction, similar to instead having a perfectly unidirectional sound source. When this sound reaches a wall, the ray is then reflected from the wall into a new direction, according to the angle of incidence, and the amplitude is adjusted according to the wall’s absorption coefficient. This procedure is repeated for the ray until it reaches the receiver point. Then the whole procedure is repeated by emitting a new ray from the source at a new random direction.
This method has some drawbacks, namely the number of required calculations for a high number of reflections, and the size of the receiver. If the receiver is a point, it will practically never be intersected by a ray. Then, the receiver must be a sphere of a certain size. But if this size is too large, then too many late reflections will be disregarded, leading to an inaccurate impulse response.
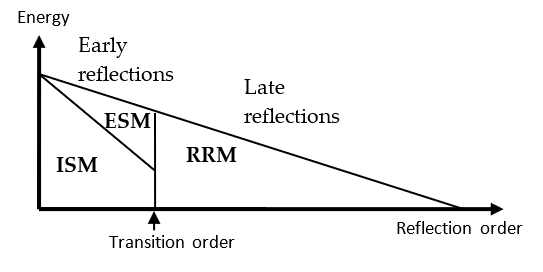
ODEON instead uses a combination of three methods: the Image Source method (ISM), the Early Scattering method (ESM), and the Ray Radiosity method (RRM). ISM and ESM are used for early reflections, and RRM is used for late reflections. This allows to get accurate results very efficiently.
A summary of the methods is described below. For more detailed descriptions you may read chapter 9 of the user manual, or watch this video.
Image source method
As in traditional ray tracing, rays are emitted in random directions from a source and reflected specularly, but only up to a certain transition order (that is, only considering early reflections). Each reflection generates an image source with an amplitude adjusted according to absorption coefficients, air absorption, scattering loss, etc. When this process has been completed, a reflection is added to the reflectogram for every one of the generated image sources that are visible from the receiver.

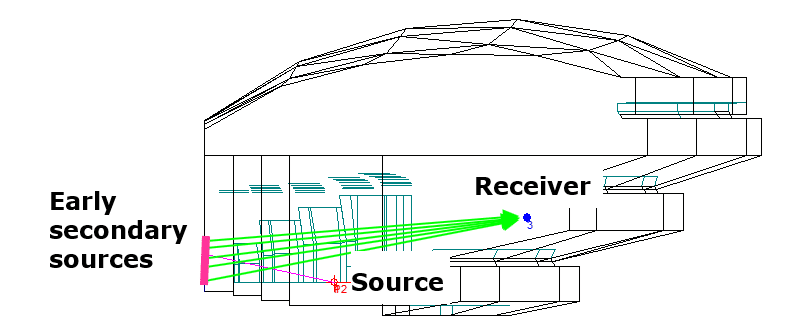
Early scattering method
On every surface containing an image source found to be visible from the receiver during the image source method, a number of early secondary sources are also generated. Rays are generated from these early secondary sources starting from the current reflection order up to the transition order. At each reflection point of the early scattering rays, including the point of origin, a new early secondary source is created. Each early secondary source visible from the receiver adds a reflection to the reflectogram.
Ray radiosity method
Rays are emitted from a source, reflected based on the vector based scattering method and taking into account scattering due to the surface size and surface roughness. These rays generate late secondary sources only after the reflection order has surprassed the transition order, and up to a pre-defined maximum reflection order. For each late secondary source visible from the receiver, a reflection is added to the reflectogram.
From 3D model into ODEON
Typically, a 3D model is made on a CAD software outside of ODEON. The CAD software with the best integration with ODEON is Trimble SketchUp, especially via our SketchUp2ODEON plug-in, but several other CAD software and model formats are also compatible with ODEON.
One must also understand the difference between a typical 3D model for mechanical, architectural, or design purposes, which include as many details as possible, versus an acoustic model, which needs to have the small details simplified. On one hand, too many small physical details can make a model unnecessarily complicated and much more computationally expensive, without necessarily yielding considerably better results. But more importantly, very small surfaces can violate some of the assumptions required for the physics used by ODEON to apply.
As an example, a piece of furniture like a chair close to a source or receiver can produce a considerable specular reflection, but modelling the legs of the chair would be excessive detail for an acoustic model. Therefore, it would be most efficient to only model the seat and back of the chair.
Still, one cannot ignore the important scattering effects caused by small physical details, for example, a crammed bookcase against a wall. Scattering is the keyword here. The bookcase can be modelled as a flat surface, and one may just apply a scattering coefficient to the surface to account for the effect of sound scattering off the books.
Common Room Acoustic Phenomena Predicted by ODEON
Echoes
Typically, early reflections arrive within 50ms relative to the direct sound and they enhance the signal heard from the receiver. So, they have a positive effect. However, any early reflection (up to 2nd or 3rd orders of reflection) that arrives later than 50ms can be perceived as a separate sound with a disturbing effect. This is called an echo and gives the impression that sound repeats itself. To perceive such an echo, the total distance travelled by the reflected sound will be at least 17m, which is derived if we multiply the speed of sound by the 50ms delay.
The Dietsch Echo curve, available in the single-point response, provides a tool to detect echoes. Spikes that arrive later than 50ms and are strong enough to surpass the horizontal lines, can potentially annoy 10%, 30% or 80% of human receivers. These limits have been derived out of subjective listening experiments, therefore they represent an average behaviour.
Flutter echoes
Not to be confused with simple echoes, described above, they are repetitive reflections between parallel walls, usually with a high frequency. Flutter echoes can easily occur between parallel walls 5m apart, and in this case the time passed between the repetitive reflections is equal to the distance divided by the speed of sound.
Focusing
A common effect caused by curved surfaces. Sound reflections can be concentrated in certain areas of the space, leaving others with too little sound. As shown in the picture below, focusing is not a problem if the radius of curvature is less than half the height of the room.
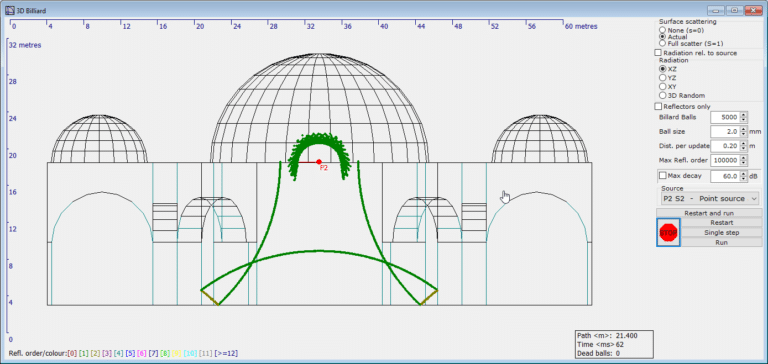
Whisper Gallery Effect
The effect occurs in cylindrical rooms, where early reflections from sources close to the walls focus on receivers close to the walls at any angle. The result is that even a low-level sound can be heard at a large distance, with surprising clarity and level.
