Estimating the sound power of sources with ODEON

Background

The sound power of a source represents the amount of acoustic energy that is emitted by the source in all directions, per unit time. It is a property of the source, measured in Watt (W). It is often presented as a sound power level in dB, relative to 1 pW.

In the context of room acoustic simulations, the sound power of a source is thus a key input parameter. However, existing measurement methods are difficult to carry out, as they require specific equipment, such as a reverberation room or a scanning apparatus. Therefore, it is common that sound power data is not available, for instance for large industrial machines, which may be too large to be properly measured.


Methodology with ODEON

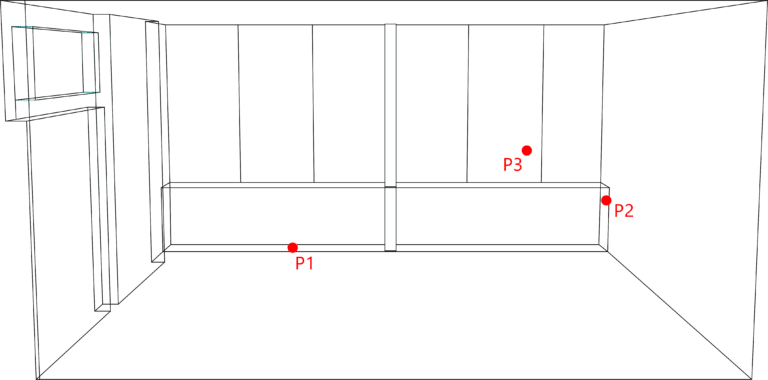
ODEON includes the Source Power Estimation Tool , which makes it possible to estimate the sound power of one or multiple sources, based on actual SPL measurement data. The estimation relies on an acoustic simulation of the room containing the source(s) to estimate, as well as multiple real-life SPL measurements at known locations. The SPLs are simulated at the same locations in the ODEON model and the source power(s) are adjusted to ensure a good agreement between the measured and simulated SPL data.

flow

Requirements

The estimation is based on several assumptions.

  • Stationary conditions: we assume all noise sources to be stationary during the measurements. This is especially true if you measure SPL during a certain length of time (say, 30 seconds), or if you measure your SPL points consecutively, due to too few available sound level meters.
  • Incoherent sources: as interference patterns are not included in ODEON simulations, we assume that the sources are incoherent between each other. This is typically true for independent machines in an industrial hall.
  • Realistic model of the room: the accuracy of the estimated power levels depends on the quality of the ODEON room model.
  • Known source and receiver locations: they need to be included in the ODEON model.


Experimental validation

The full validation can be found in our conference publication, presented in Internoise 2023.

The source power estimation method was tested in a room of  the Technical University of Denmark. The test room was an empty laboratory room, on which absorbers were installed on most walls and the ceiling. Therefore, the room is acoustically dry, with a reverberation time of about 0.3 s.

ODEON model of the test room. The red dots indicate the three sources in the room.

In the room, up to three sources were emitting noise simultaneously.

  • S1: an aerodynamic reference source from Brüel & Kjær, type 4204.
  • S2: an Odeon Omni loudspeaker playing a stationary pink noise signal.
  • S3: an Odeon Omni playing stationary noise with a different spectrum.
sources
Left: B&K type 4204 source. Right: Odeon Omni source.

The SPL was measured at different locations in the room. Different scenarios were tested, where 1 source, 2 sources or 3 sources were active. Three sound level meters were available at the time of the measurements, so the SPLs were measured 3 by 3, assuming stationary conditions. We tested the estimation with different numbers of receivers.

photo
SPL measurement in the test room. Three sound level meters were available during the measurements.

Findings

Overall, it is possible to retrieve the sound power of sources, provided that enough SPL data has been collected. We typically recommend 3 receivers in the vicinity of each source. Using more receivers did not improve the results much.

 
S1 active, 3 receivers

The estimated sound power is very close to the data specified in the source’s technical sheet. More deviations are found at lower frequencies, where the ODEON model is not as accurate.

Untitled-3
Selected receivers when S1 is active.
image020
S1 active. Estimation of the source power of S1 with 3 receivers and comparison with technical reference data.
S1 and S2 active, 6 receivers

We make sure that some receivers are placed close to Source 1, and some others close to Source 2. Reference sound power levels are obtained with only one source active and as many receivers as possible.

Untitled-4
Selected receivers when S1 and S2 are active.
graph-1
S1 and S2 active, 6 receivers. Estimation of S1 (Left) and S2 (Right).

Both sources are fairly well estimated from 250 Hz to 8 kHz. Larger errors at lower frequencies are due to the mismatch between the model and the real room, measurement uncertainties, and a lower SNR.

 
All three sources active, 9 receivers

Again, we make sure to place receivers in the vicinity of each source.

Untitled-5
Selected receivers when S1, S2 and S3 are active.
S1, S2 and S3 active. Sound power estimation of each source.

All three sound powers are fairly well estimated between 250 Hz and 4 kHz. Again, the lower octave bands tend to be more challenging. In addition, at 8 kHz, S3 is completely discarded. This is because its power is much lower than the two other sources, so its influence on the SPL data is insignificant.

In summary, estimating a single source is the simplest problem. A few dBs of error can be expected when several sources are active at the same time, but the spectrum is still overall recovered with enough measurement data.


Some challenges

During the validation, we identified a few challenges, which might compromise the estimation.

 
Masking

A stronger source may mask a weaker source, meaning that the measured SPL will be largely due to the stronger source only. In that sense, the assigned sound power of the weaker source has very little impact on the resulting SPL data, and the algorithm may yield a wrong sound power for the weaker source. This is illustrated with the uncertainty bar in ODEON. A large bar means that the sound power of the source does not change the fit between measured and simulated data considerably. For example, in the figure below, the power of source 3 at 8 kHz can vary greatly without impacting the overall fit.

S1, S2 and S3 active. ODEON interface showing the estimation of S3, including uncertainty bars.
Model accuracy

The estimation is based on fitting measured and simulated SPL data. If the model is not accurate enough, then the simulated SPLs will not be reliable, and it will compromise the estimated sound powers. Therefore, you should make sure the model matches reality as best as possible. In that context, ODEON’s genetic material optimizer is a great tool to adjust the material properties in the model. 

 
Room conditions

The validation was made in an acoustically dry environment, where we can expect relatively large variations in SPL. This helps in solving the underlying optimisation problem. A more reverberant environment would probably be more challenging, as more mixing between the sources would occur at the measurement positions.

Download the data

Below you may download an ODEON Zip Archive of this example, which is a packaged ODEON model (for ODEON Auditorium or Combined, 15.15 or newer) containing all the necessary files to run it: room geometry, measured SPL data, assigned materials, source and receiver placements, etc. Try the Sound Power Estimation tool yourself! Check the Read me document for more information. 
Tip: If you need to recover the entire measurement dataset, you can download the zip file below. Just copy the content of the Zip file to the room’s folder.

 
To unzip an ODEON Zip Archive:
  1. Launch ODEON
  2. Go to File > Zip > Unzip archive
  3. Select your downloaded ODEON Zip Archive
  4. Select a folder to extract the files 
 

ODEON will then automatically load the room.

Read me

PDF containing the details of the ODEON Zip Archive and the Measurement files.

ODEON Zip Archive download

Room: Test room from DTU.

Measurement data

Room: Test room from DTU. Real room measurements performed by ODEON A/S. 

We have more ODEON Zip Archives available for download, which include different room models and anechoic recordings.

References and links


Read more on Sound Power Estimation

Note: the sound power estimation feature is available in the Industrial and Combined editions of ODEON 17 and up.

 
Sound sources